
Sometimes a Semilattice prediction lands with one answer at 99.8%, or two answers stacked at 99.9% combined. That means our model is predicting almost everyone in the audience gave the exact same answer to a question, or one of two answers. Intuitively this almost never happens in reality; humans are more diverse than that. So these predictions have always looked wrong, which is a problem.
What to do about it has been less clear. We’ve considered filtering the questions that produce extreme outputs before they reach the user; labelling any prediction above some confidence threshold as low-confidence; or accepting that filtering and labelling are surface fixes, and invest in the underlying models instead.
We then decided to run an audit. We pulled 1,000 test predictions from our database; predictions where we have the ground truth answer from the target audience. We then compared the predictions to the ground truth across two measures: how far each option's predicted percentage sits from reality, and how different the whole distribution shape is. (Methodology details at the bottom.)
The picture turned out to be a lot more nuanced than we assumed.
The headline
Across those thousand questions, our general accuracy holds: three quarters of predictions land within our accuracy threshold, with the median comfortably inside it.
The chart below measures this accuracy distribution with a metric called normalised KL Divergence (or relative entropy). A lower nKLD score means the prediction is more accurate.
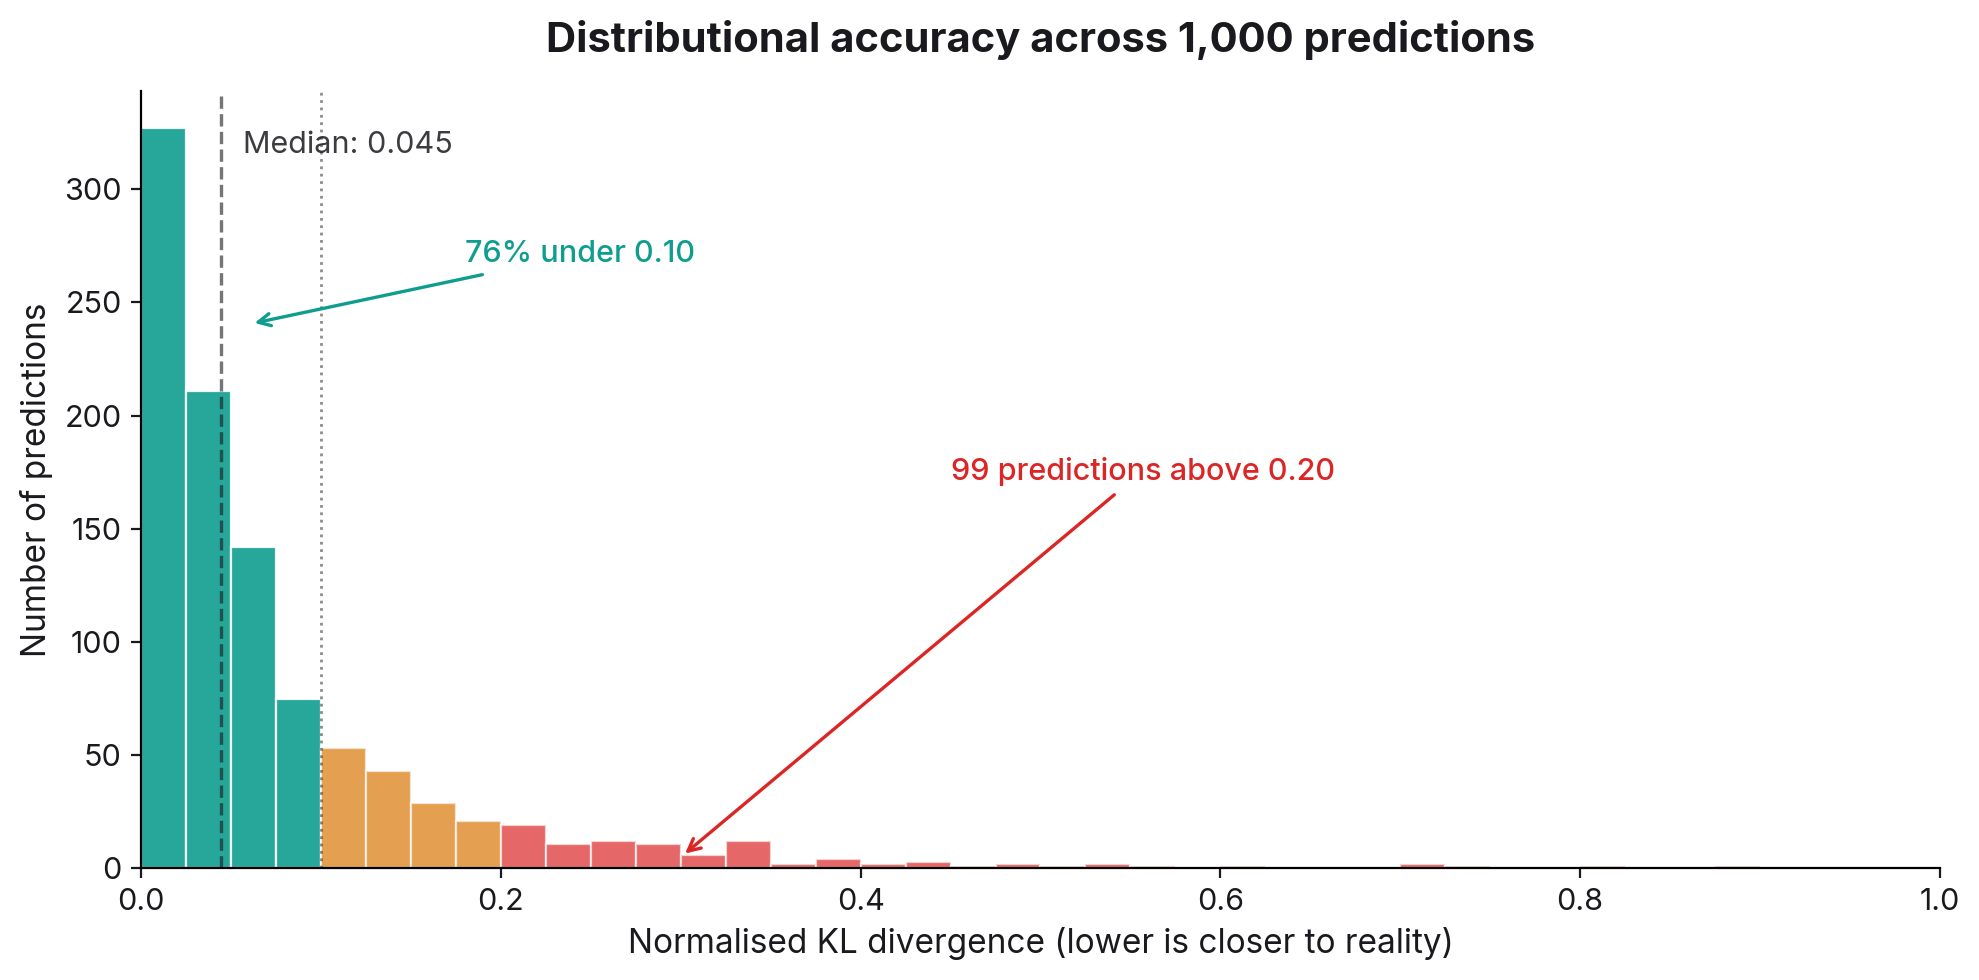
The problem we kept arguing about is real, but it's a tail problem. Most predictions are good. The argument is about the quarter that isn't.
Pulling the thread on "extreme"
We started by counting. We classified a prediction as extreme if a single option exceeded 90% of the distribution, or the top two options together exceeded 90% on questions with more than two options. 278 of the 1,000 predictions met one of those conditions. About one in four. That matches our gut sense from using our product.
The first thing we checked was the obvious story: extreme predictions are inaccurate predictions. If that were true, filtering extremes would clean the output.
It isn't true. Of the 278 extreme predictions, only 112 had distributional error above our concern threshold. The other 166 were within tolerance. And there were 133 inaccurate predictions outside the extreme set: distributions that looked unremarkable on screen but were significantly off in their shape.
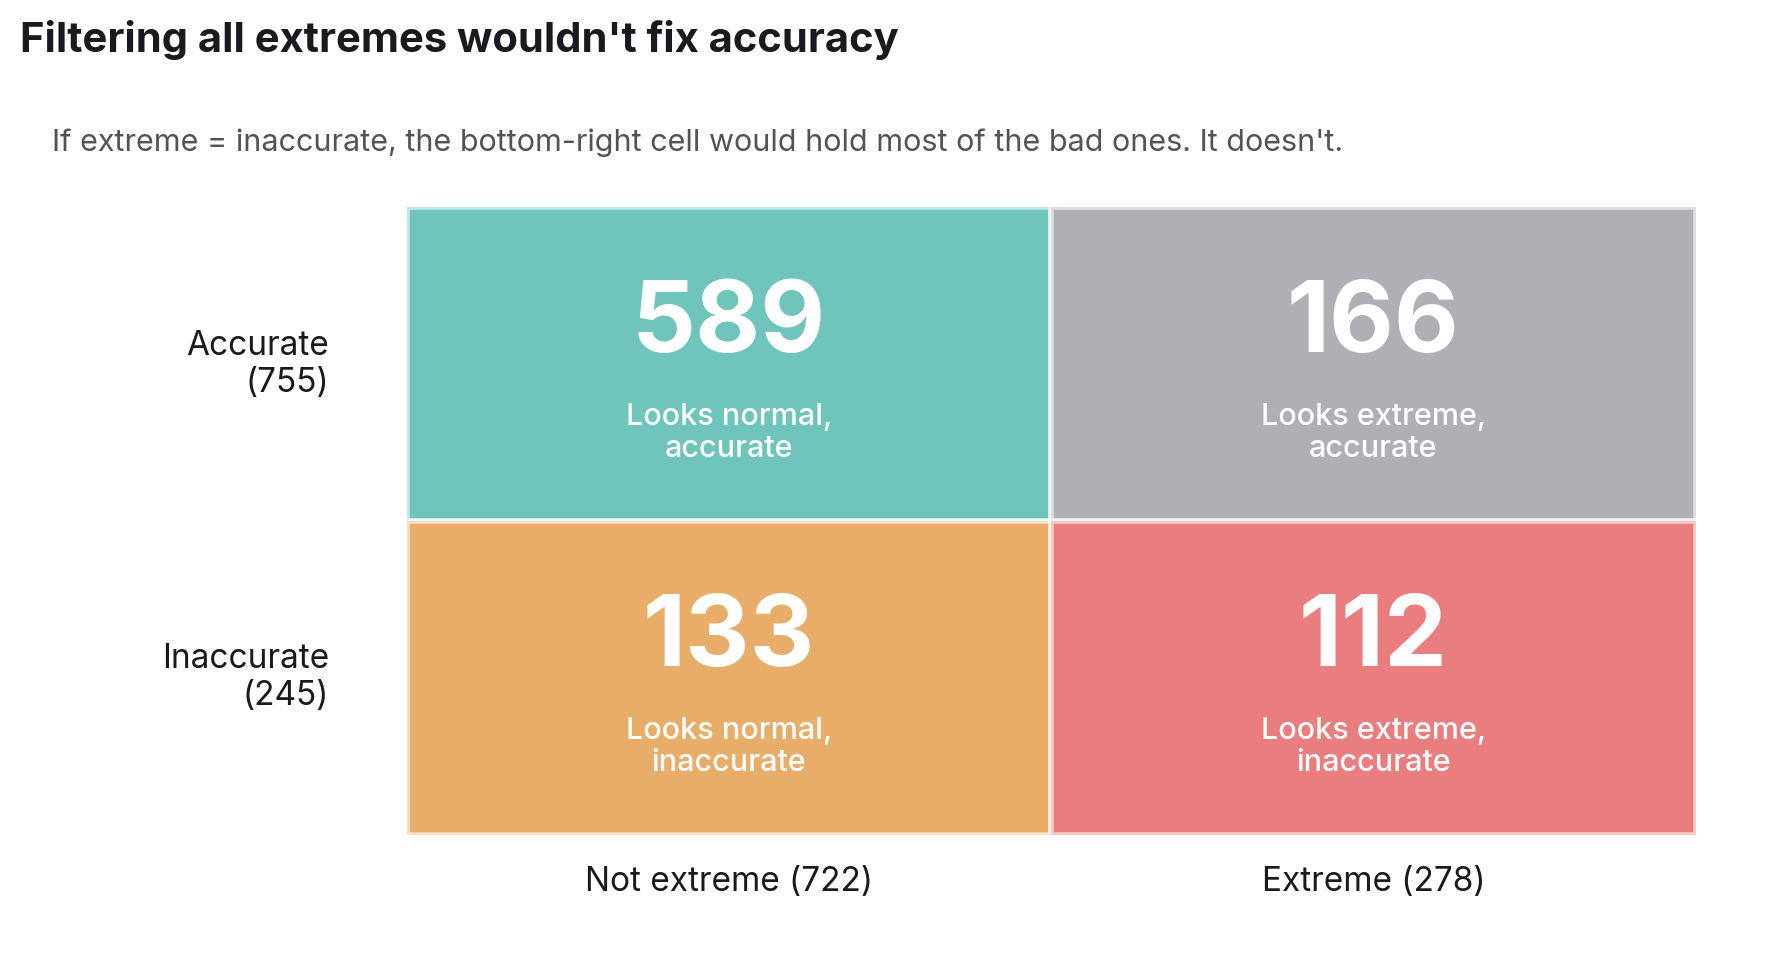
Filtering all extremes would have meant discarding 166 good predictions to catch 112 bad ones, while still letting 133 quietly inaccurate predictions through. The simple rule does worse than nothing.
The split that matters
Here is where the audit got interesting. The 278 extreme predictions split two ways.
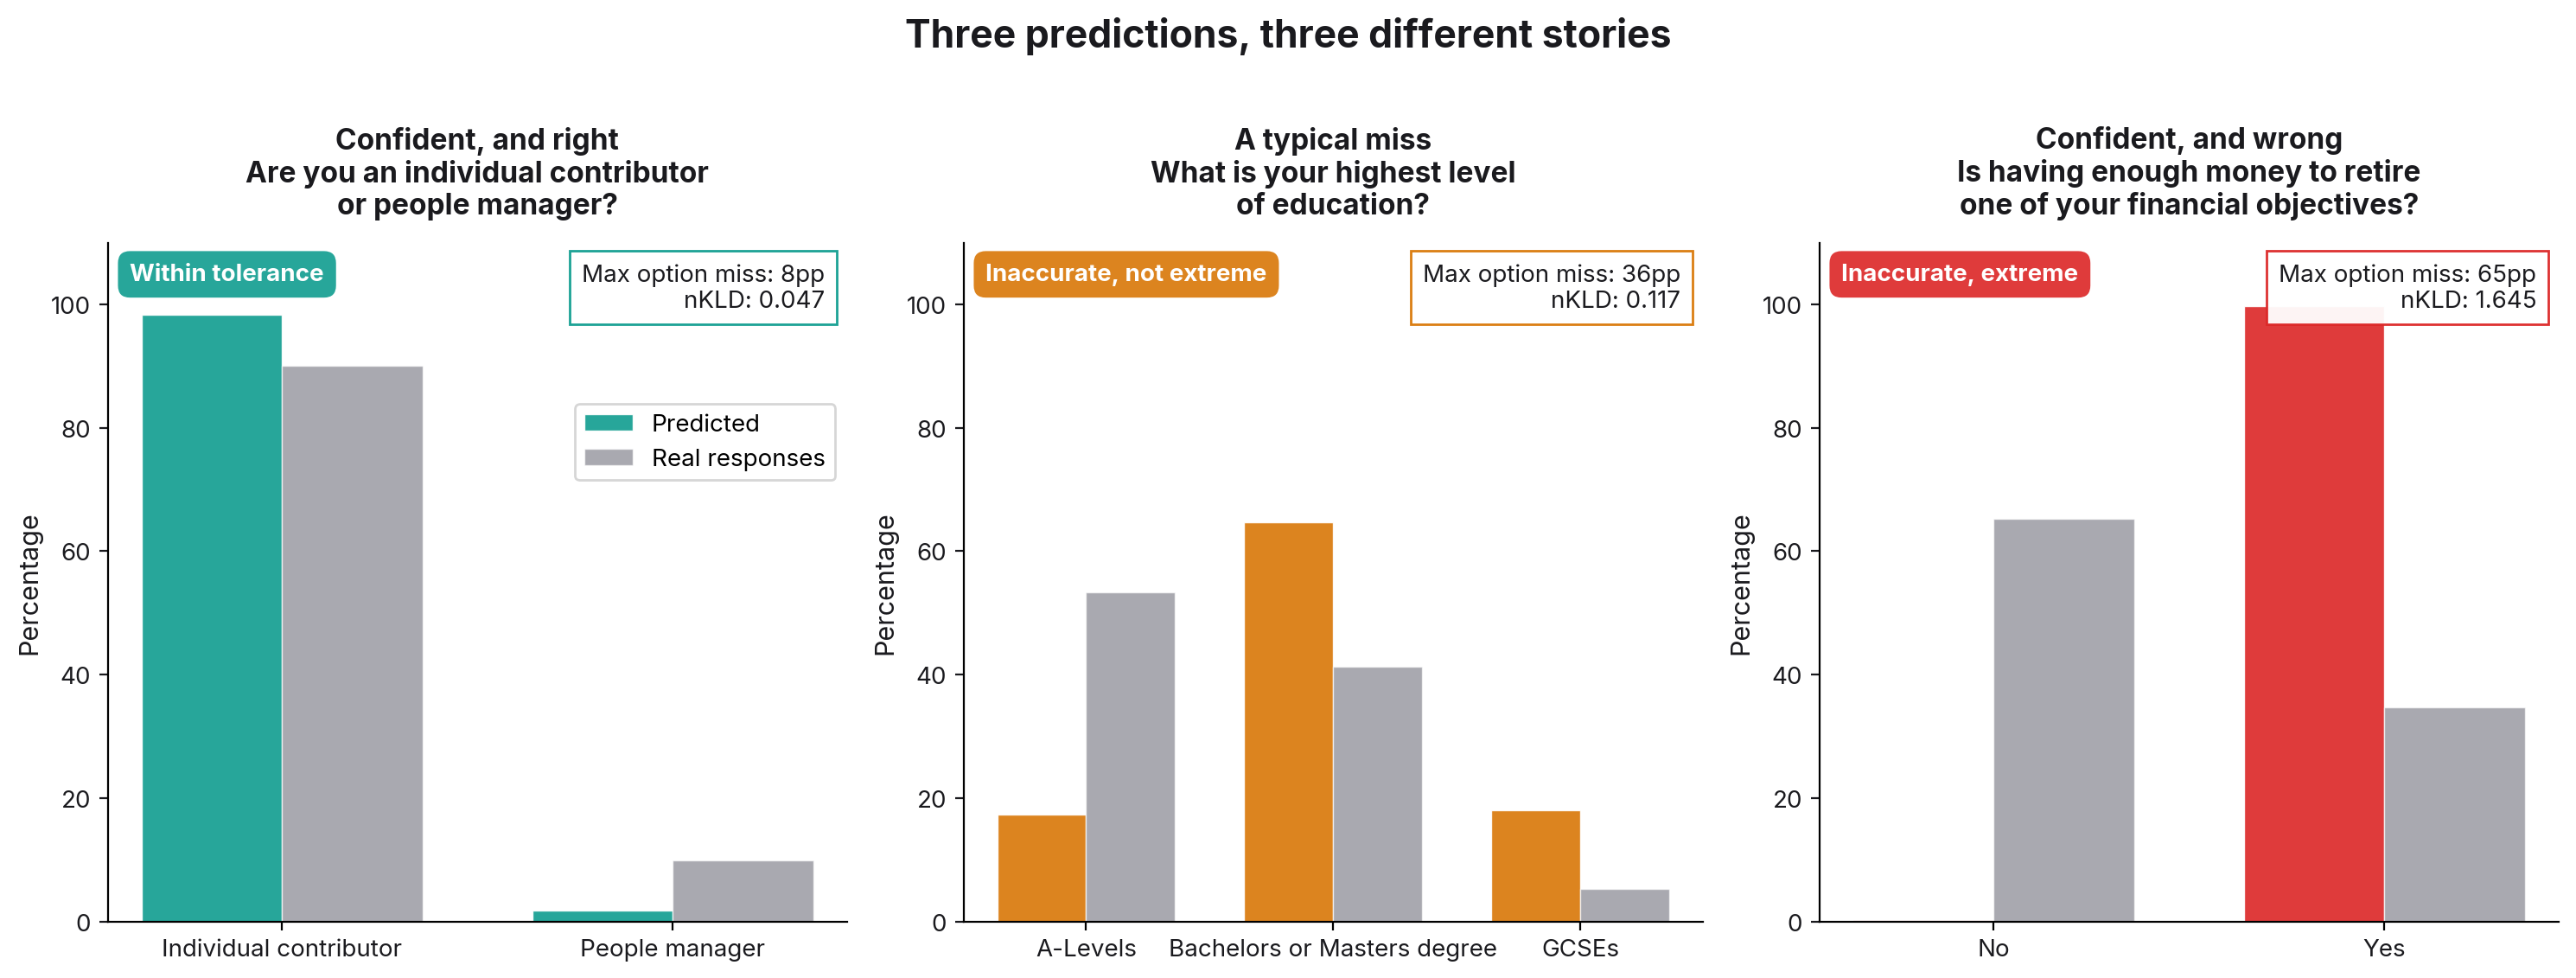
In 188 of them, the model put 90%+ on the same answer that real respondents also picked most. The model was right; it was just overconfident. The real responses on those questions cluster heavily on one option, and the model picked up that signal, possibly too eagerly, but in the right direction. Distributional error on these averages 0.08, in line with the median across all questions.
In the other 90, the model put 90%+ on the wrong answer. Distributional error on these averages 0.25. The single largest option-level miss averages 49 percentage points: the model says yes 99%, reality says yes 35%.
That second group is where the trust problem actually lives. Specific cases where the model picked the wrong modal answer and concentrated all of its probability on it, triggering the humans (us and our users) that focused on these often obvious misses.
On screen, both groups look the same: confident numbers in the 90s. But 188 of them are the model agreeing strongly with real responses, and 90 are the model being confidently wrong.
Why the simple fixes don't work
Before the audit we had begun discussing two types of fixes.
The first is to filter the questions that tend to produce extreme outputs before the user sees them. Strip out the question types most likely to come back with concentrated distributions, run the simulation on the remainder, present what's left.
The audit makes that hard to defend. The questions with the strongest extreme-correlated failure modes are binary attitudinal and preference questions: yes/no questions about what people think and want. They're also questions that are helpful to most users. Filtering them out doesn't fix the underlying behaviour; it hides the questions where the model is most likely to fail. But the ones the model gets right disappear as well.
The second is a UI confidence label: any prediction with a single option above 90%, or top two above 90%, gets flagged in the interface as low-confidence. The user is warned, the prediction stays visible, the team can decide what to trust.
The audit kills this one too, just less obviously. Because 188 of the 278 extreme predictions are correct, two-thirds of what such a label would fire on are predictions that deserve confidence. The reader would learn quickly that the warning fires on accurate outputs as often as on inaccurate ones, and would stop reading it. The label would do real damage to predictions that are genuinely extreme because the ground truth (and the world) is genuinely extreme: questions where almost everyone really does answer the same way.
The shared failure mode in both fixes is the same. They operate on the surface signal: the prediction looks too concentrated, so flag it. The audit shows the surface signal is too noisy to act on. The 90% number is genuinely informative on some questions and genuinely misleading on others, and those two groups can't be separated by the percentage alone.
What we're working on
The signal that does separate the two groups is whether the model picked the right modal answer. That information is only available after the fact, against ground truth, which is exactly what we have for our test set and exactly what we don't have at simulation time.
The right intervention isn't on the output. It's on the input. The 90 confident-wrong predictions cluster on questions whose answers depend heavily on who was surveyed. The model defaults to a generic prior (most people want more money, most people are saving for retirement) that doesn't match the specific population the user model was trained on. The failure is in the model's knowledge of the population, not in the shape of any single distribution.
The path forward is what we've already been building toward: a new generation of user models, LLMs we fine-tune ourselves on masses of partner data. Surveys, qualitative interviews, behavioural signals from the population our customers actually care about. We're working on this with our first design partners now, alongside continued research into the underlying modelling approach. Better population context turns a generic prior into a specific one. We hope the 90 wrong-modal extremes will largely disappear when the model has more data on the population it's modelling.
The results have also changed the way we talk about this internally. There isn't really an "extreme predictions" problem. There's a confident-wrong problem that looks similar to a confident-right pattern. We'd been arguing about the visible symptom for a long time, but it's clear there is no simple fix apart from continuing our work of building, measuring, and improving our user models.
Methodology notes
- 1,000 questions sampled at random from production simulations in "Tested" status, none deleted.
- Each prediction was generated by the user model against the source survey with the specific test question held out. Ground truth is the real response distribution from that survey.
- Predicted versus real distributions compared using mean absolute error (MAE), root mean squared error (RMSE), normalised KL divergence (nKLD).
- "Inaccurate" threshold for the analysis above: nKLD > 0.10. About one in four predictions cross it.
- "Extreme" threshold: top option exceeds 90%, or top two options together exceed 90% on questions with more than two options.
Talk to us if you're interested in the methodology or in how we're addressing the issues in our next generation of user models.