
The statistician George Box said it decades ago: all models are wrong, but some are useful. The question was never whether a model is perfectly accurate. The question is whether you can see where it's wrong, and decide for yourself whether it's useful enough for your decision.
Most tools that predict user behaviour don't give you that option. You get a number on a landing page, maybe a whitepaper with aggregate benchmarks, and you're expected to trust it. The accuracy claim is a marketing asset, not something you can pull apart and examine.
We think that's backwards. So we redesigned audiences in Semilattice to make accuracy fully inspectable.
A black box model at 89% is less useful than a transparent model at 89%
Consider two systems that both claim 89% accuracy on predicting consumer attitudes. One gives you the number and asks you to take it on faith. The other lets you see which questions it gets right, which it gets wrong, what data it learned from, and how it performs on questions it has never seen before.
The number is the same but the second system is far more useful, because you can calibrate your trust to the specific decision you're making. If you're exploring pricing sensitivity and the model is weak on price-related questions, you should know that before you act on its predictions. If it's strong on brand perception questions, that's worth knowing too.
Accuracy isn't a single number. It's a surface with peaks and valleys, and the valleys matter as much as the peaks do.
What the redesign gives you
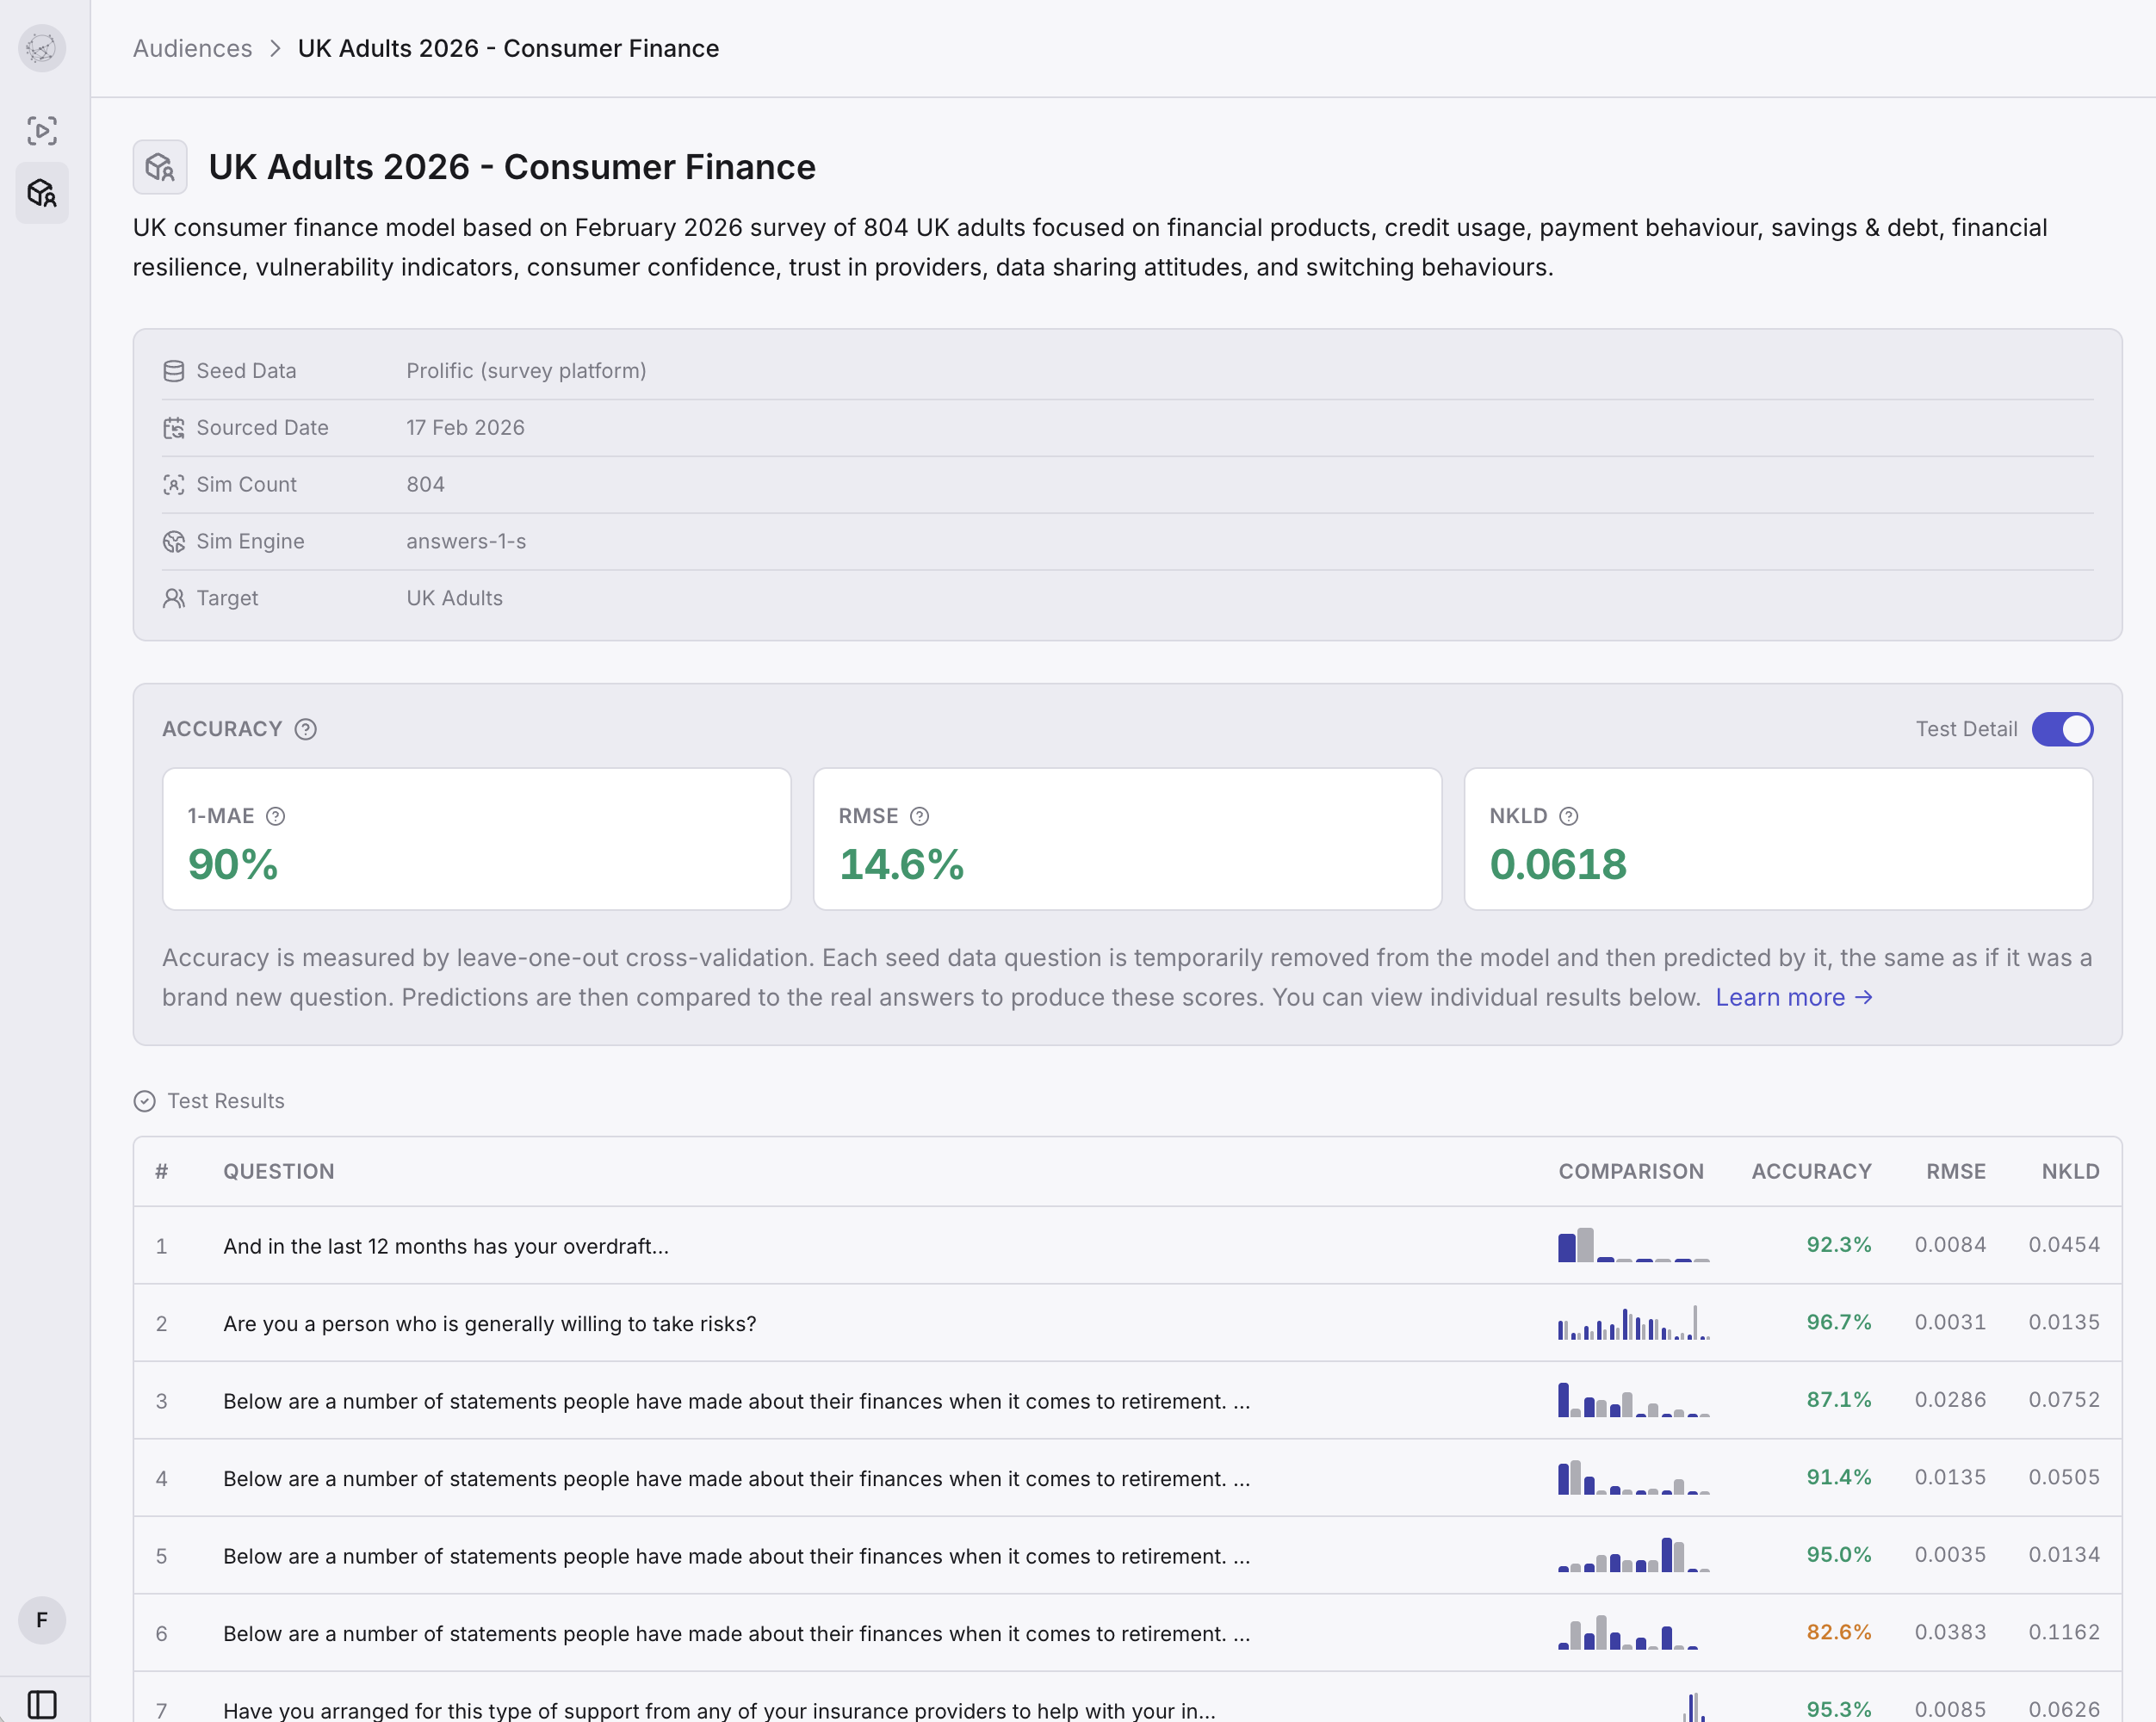
Every audience in Semilattice now has its own detail page where you can see exactly how it was built and how it performs. At the top, an accuracy badge tells you the overall score at a glance: green for 85% and above, amber for 75 to 85%, red below 75%. You know immediately how much confidence to place in results from this audience.
Below the badge you see rich cards with demographics, attitudes, and context metadata. These aren't generated personas or LLM hallucinations dressed up as market segments. They're built from real survey data collected from real people, and the detail page shows you the source so you can verify that for yourself.
Seed data and validation
Each audience page separates two things that are easy to conflate: the data the model learned from (seed data) and how it performs on data it hasn't seen (validation). You can toggle between them to understand both.
Every audience has built-in cross-validation: each seed data question is temporarily removed from the model and predicted as if it were new, then compared to the real answer. This gives you an accuracy score that the model can't game by memorising its training data. This is what the detail page shows you today.
We also validate audiences against external surveys they've never seen, though these results aren't in the dashboard yet. For example, our 16 UK Consumer Finance audiences are validated against the FCA Financial Lives Survey: 212 questions the model never saw during training, with 89% average accuracy. This is a harder test than cross-validation because the questions come from a completely different source. We've published the full comparison on the blog.
Drilling into individual questions
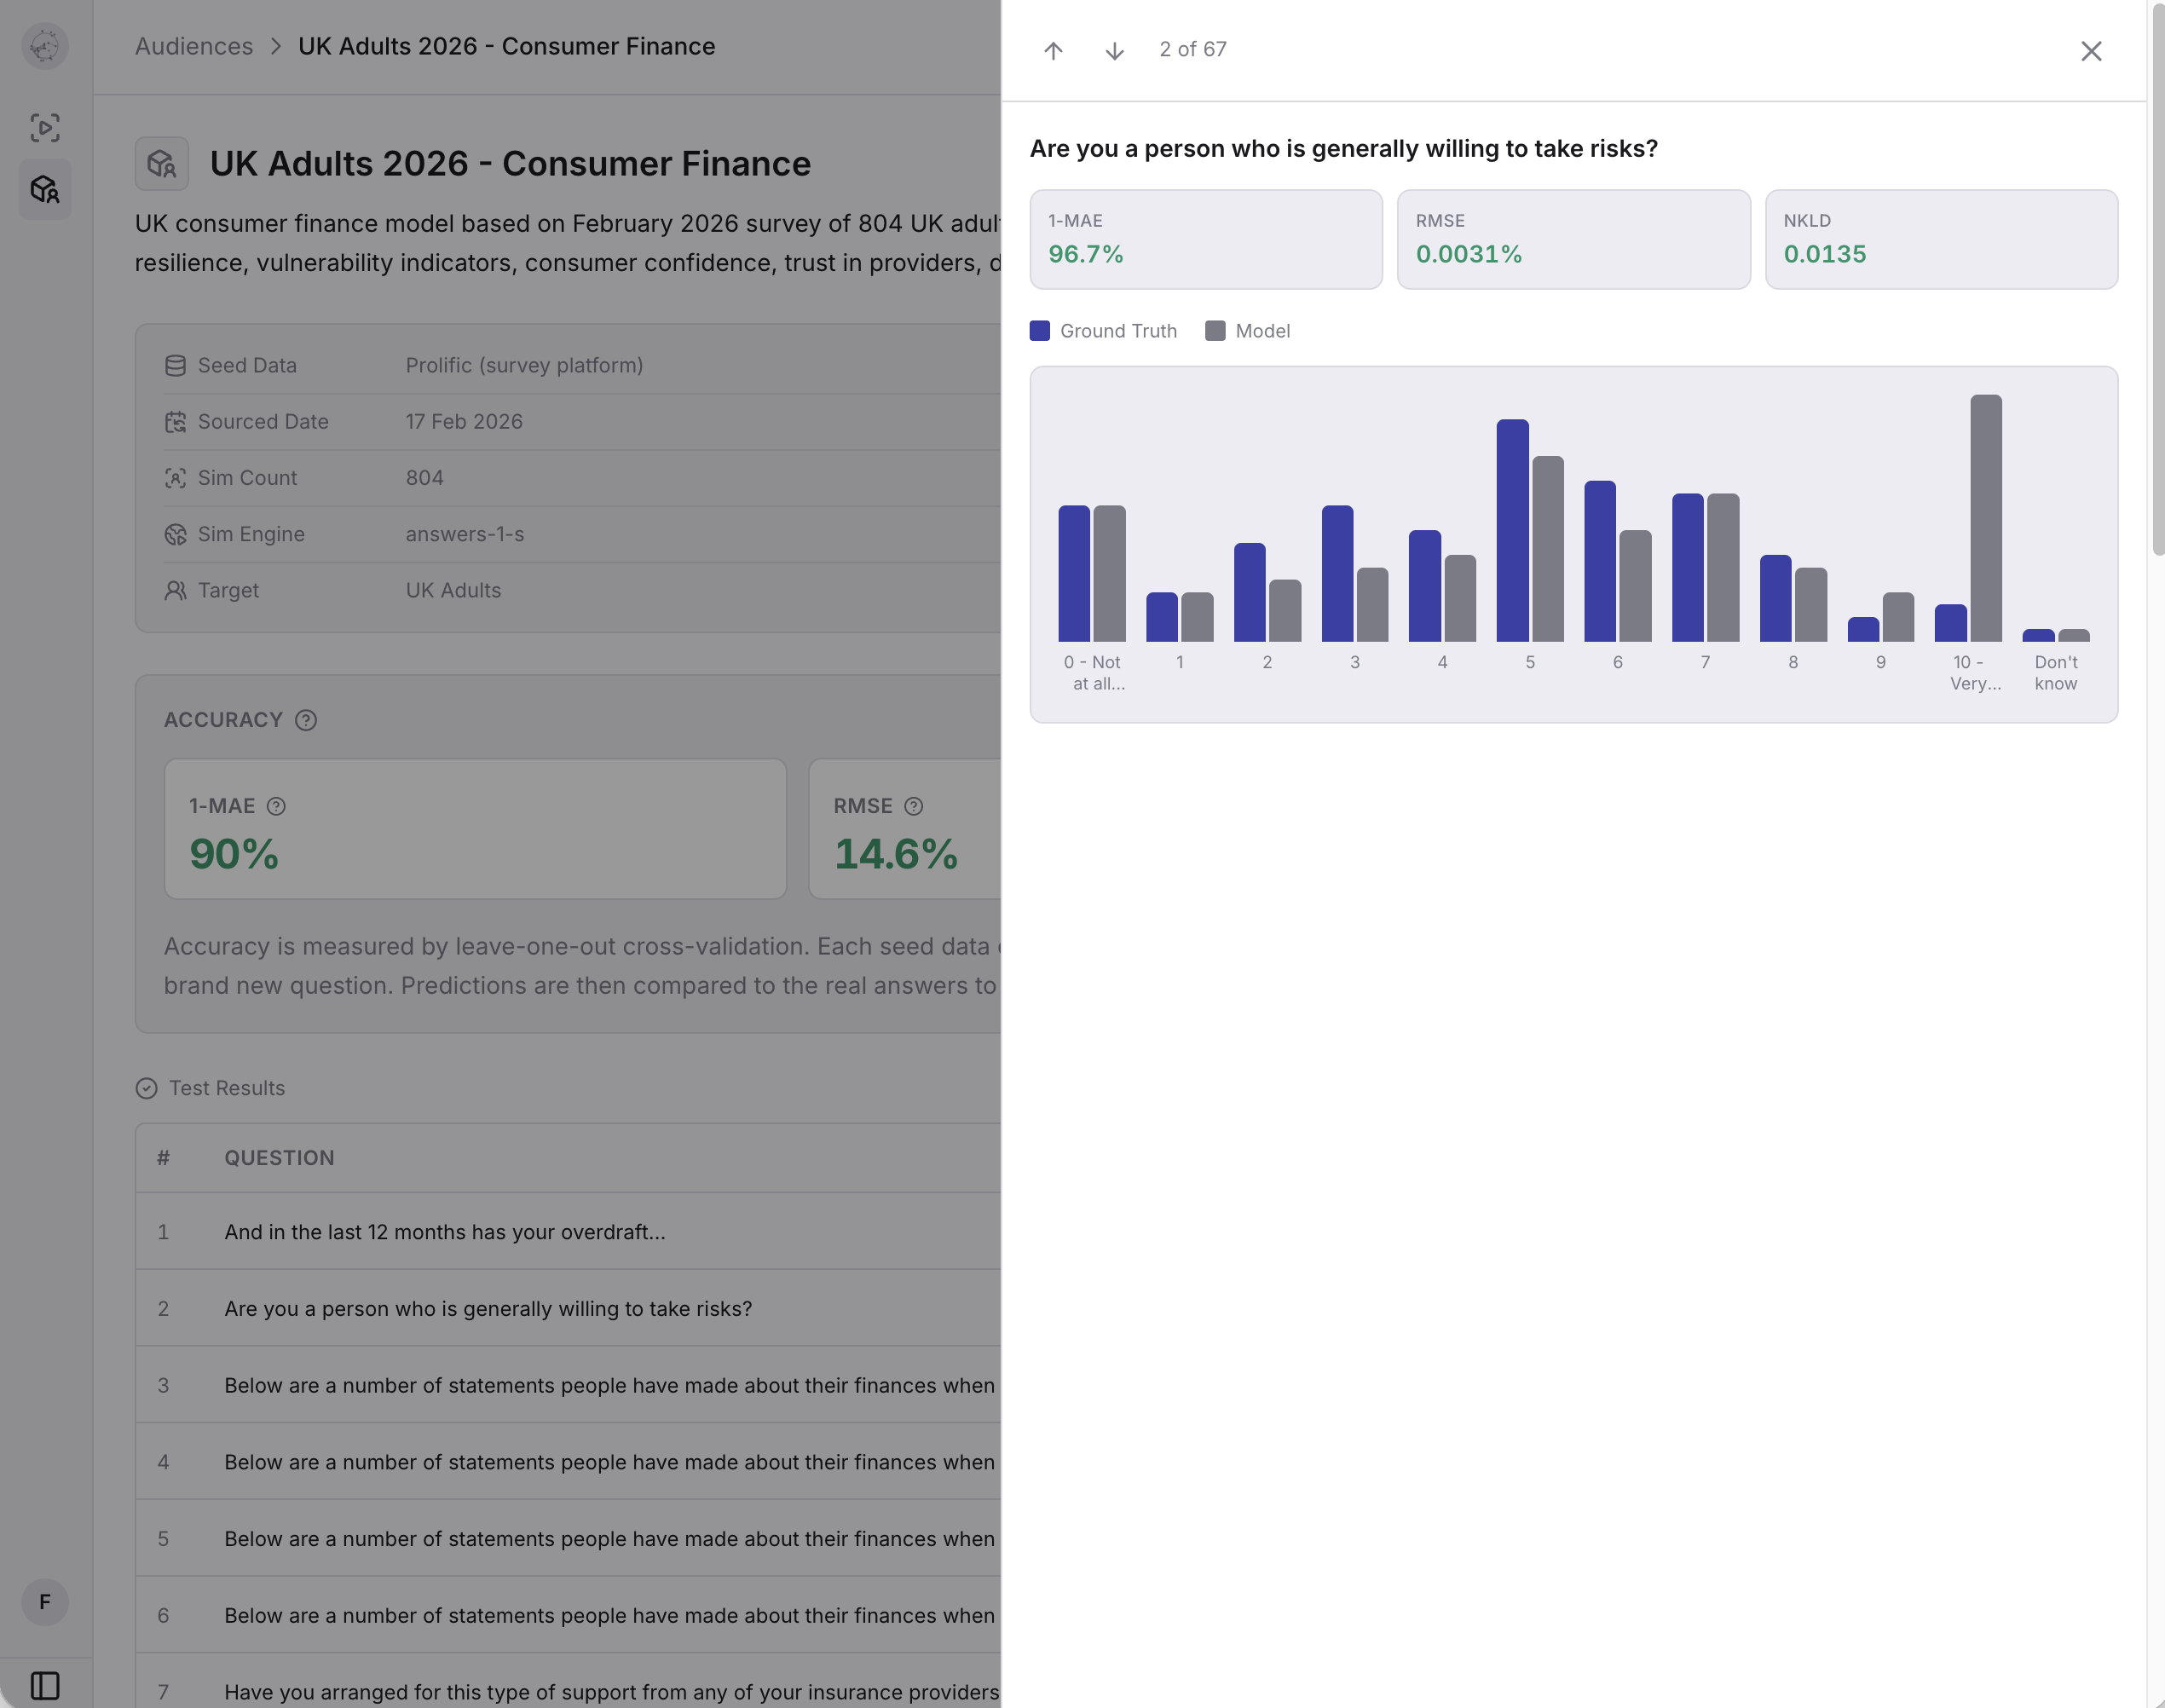
The aggregate accuracy score is useful, but the interesting part is underneath. Click into any question and you see ground truth on the left, model prediction on the right, displayed as paired bar charts with no aggregation hiding anything.
Some questions the model gets almost exactly right. Others it misses, and the misses are worth studying. A model that systematically overestimates confidence in a product category is telling you something about its limitations that should change how you interpret results in that area. A model that's weak on "don't know" responses is modelling a more decisive consumer than actually exists. These patterns are more useful than the aggregate number, because they tell you specifically where to be cautious.
What accuracy means for different decisions
Not every product decision needs the same level of confidence from an audience model. If you're exploring early-stage concepts and trying to narrow down three directions to one, an audience with 87% accuracy gives you a useful signal. You're looking for relative differences between options, not precise predictions, and the model is strong enough for that.
If you're making a pricing decision that affects revenue directly, you want to know exactly how reliable the model is on price-sensitivity questions specifically, not just its aggregate accuracy. The drill-down lets you check that. And if the model is weak in the area that matters most to your decision, it's better to know that upfront than to discover it after you've shipped.
The design principle behind the redesign is that you should never have to take our word for it. Different decisions require different levels of trust, and the tools for calibrating that trust should be in your hands, not ours.
Where the data comes from
One question we get in almost every conversation is: "Where do your audiences come from?" The redesign makes that answerable on every audience page.
Our ready-made audiences are built from real survey data. Large-scale attitudinal surveys that ask real people about their preferences, behaviours, concerns, and decision patterns. These aren't synthetic profiles generated by a language model. They're statistical portraits grounded in how real people actually responded to real questions.
The detail page shows you the source data for each audience: when it was last updated, how large the sample is, what survey instruments were used. For custom audiences built from your own data, you see exactly what you provided and how it was used to construct the model. We think this level of transparency is table stakes for any system that claims to represent your users, but most tools in this category don't offer it.
Why we built it this way
We built inspection tools because we think accuracy in predictive models needs to be earned continuously, not claimed once. If we want you to trust the results enough to make product decisions based on them, you need to be able to verify that trust yourself. Not because we say so. Because you can see the evidence.
This is also how we hold ourselves accountable. When accuracy is visible, we can't hide behind aggregate numbers. Every audience, every question, every gap is on display. That creates pressure to improve, which is exactly the kind of pressure we want.
What's next
The redesign is live, please reach out to get set up. You can browse audiences from the sidepane, search and filter across everything, and request a custom audience from any screen.
Accuracy inspection is a starting point, not a destination. We're working on richer validation across more audience types, comparison tools that let you benchmark audiences against each other, and better ways to surface which questions matter most for your specific use case. We'll share the progress as we go.