
Semilattice builds simulated audience models: AI population models grounded in real survey data that predict how specific groups of people would respond to questions they've never been asked. We recently tested our UK Consumer Finance audience model against the FCA Financial Lives Survey, the UK regulator's most comprehensive benchmark. We asked it to predict the answers to 207 questions it had never seen. Here's what happened.
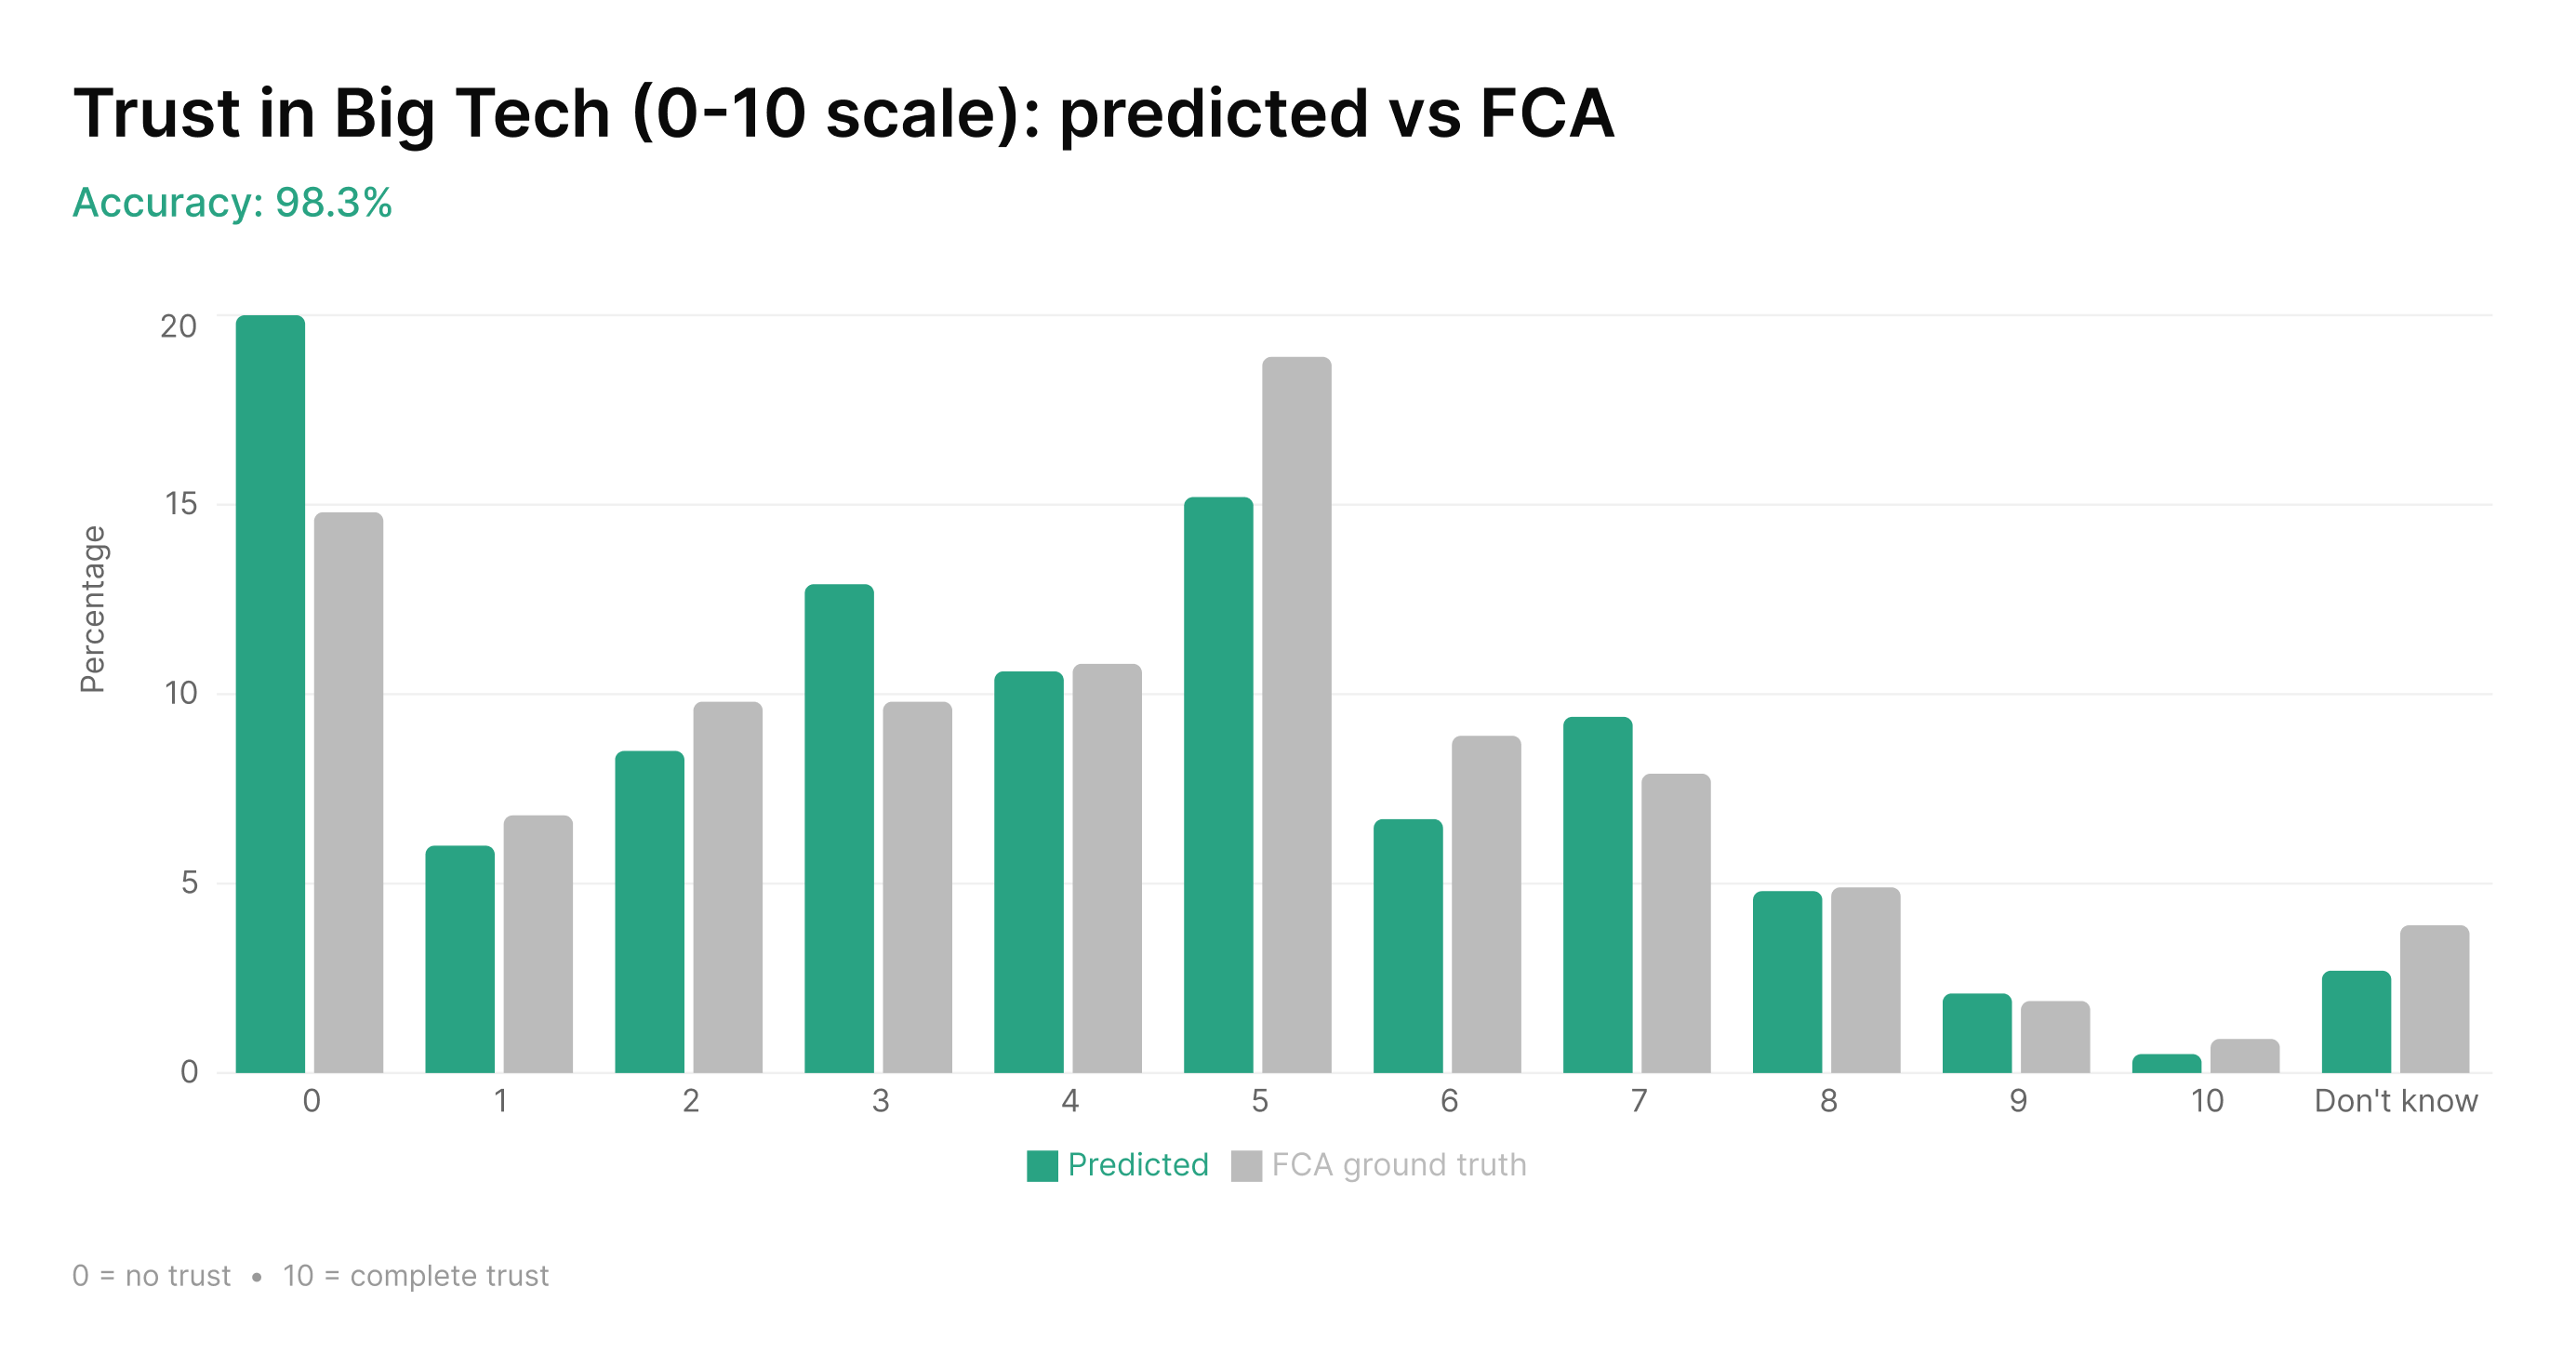
We asked the model how much people trust Big Tech, on a scale from 0 to 10. The FCA asked 19,000 real people the same question. Twelve options. The model matched the FCA's distribution across every single one. The skew toward distrust, the mid-range hump, the long tail toward total trust. All within a few percentage points.
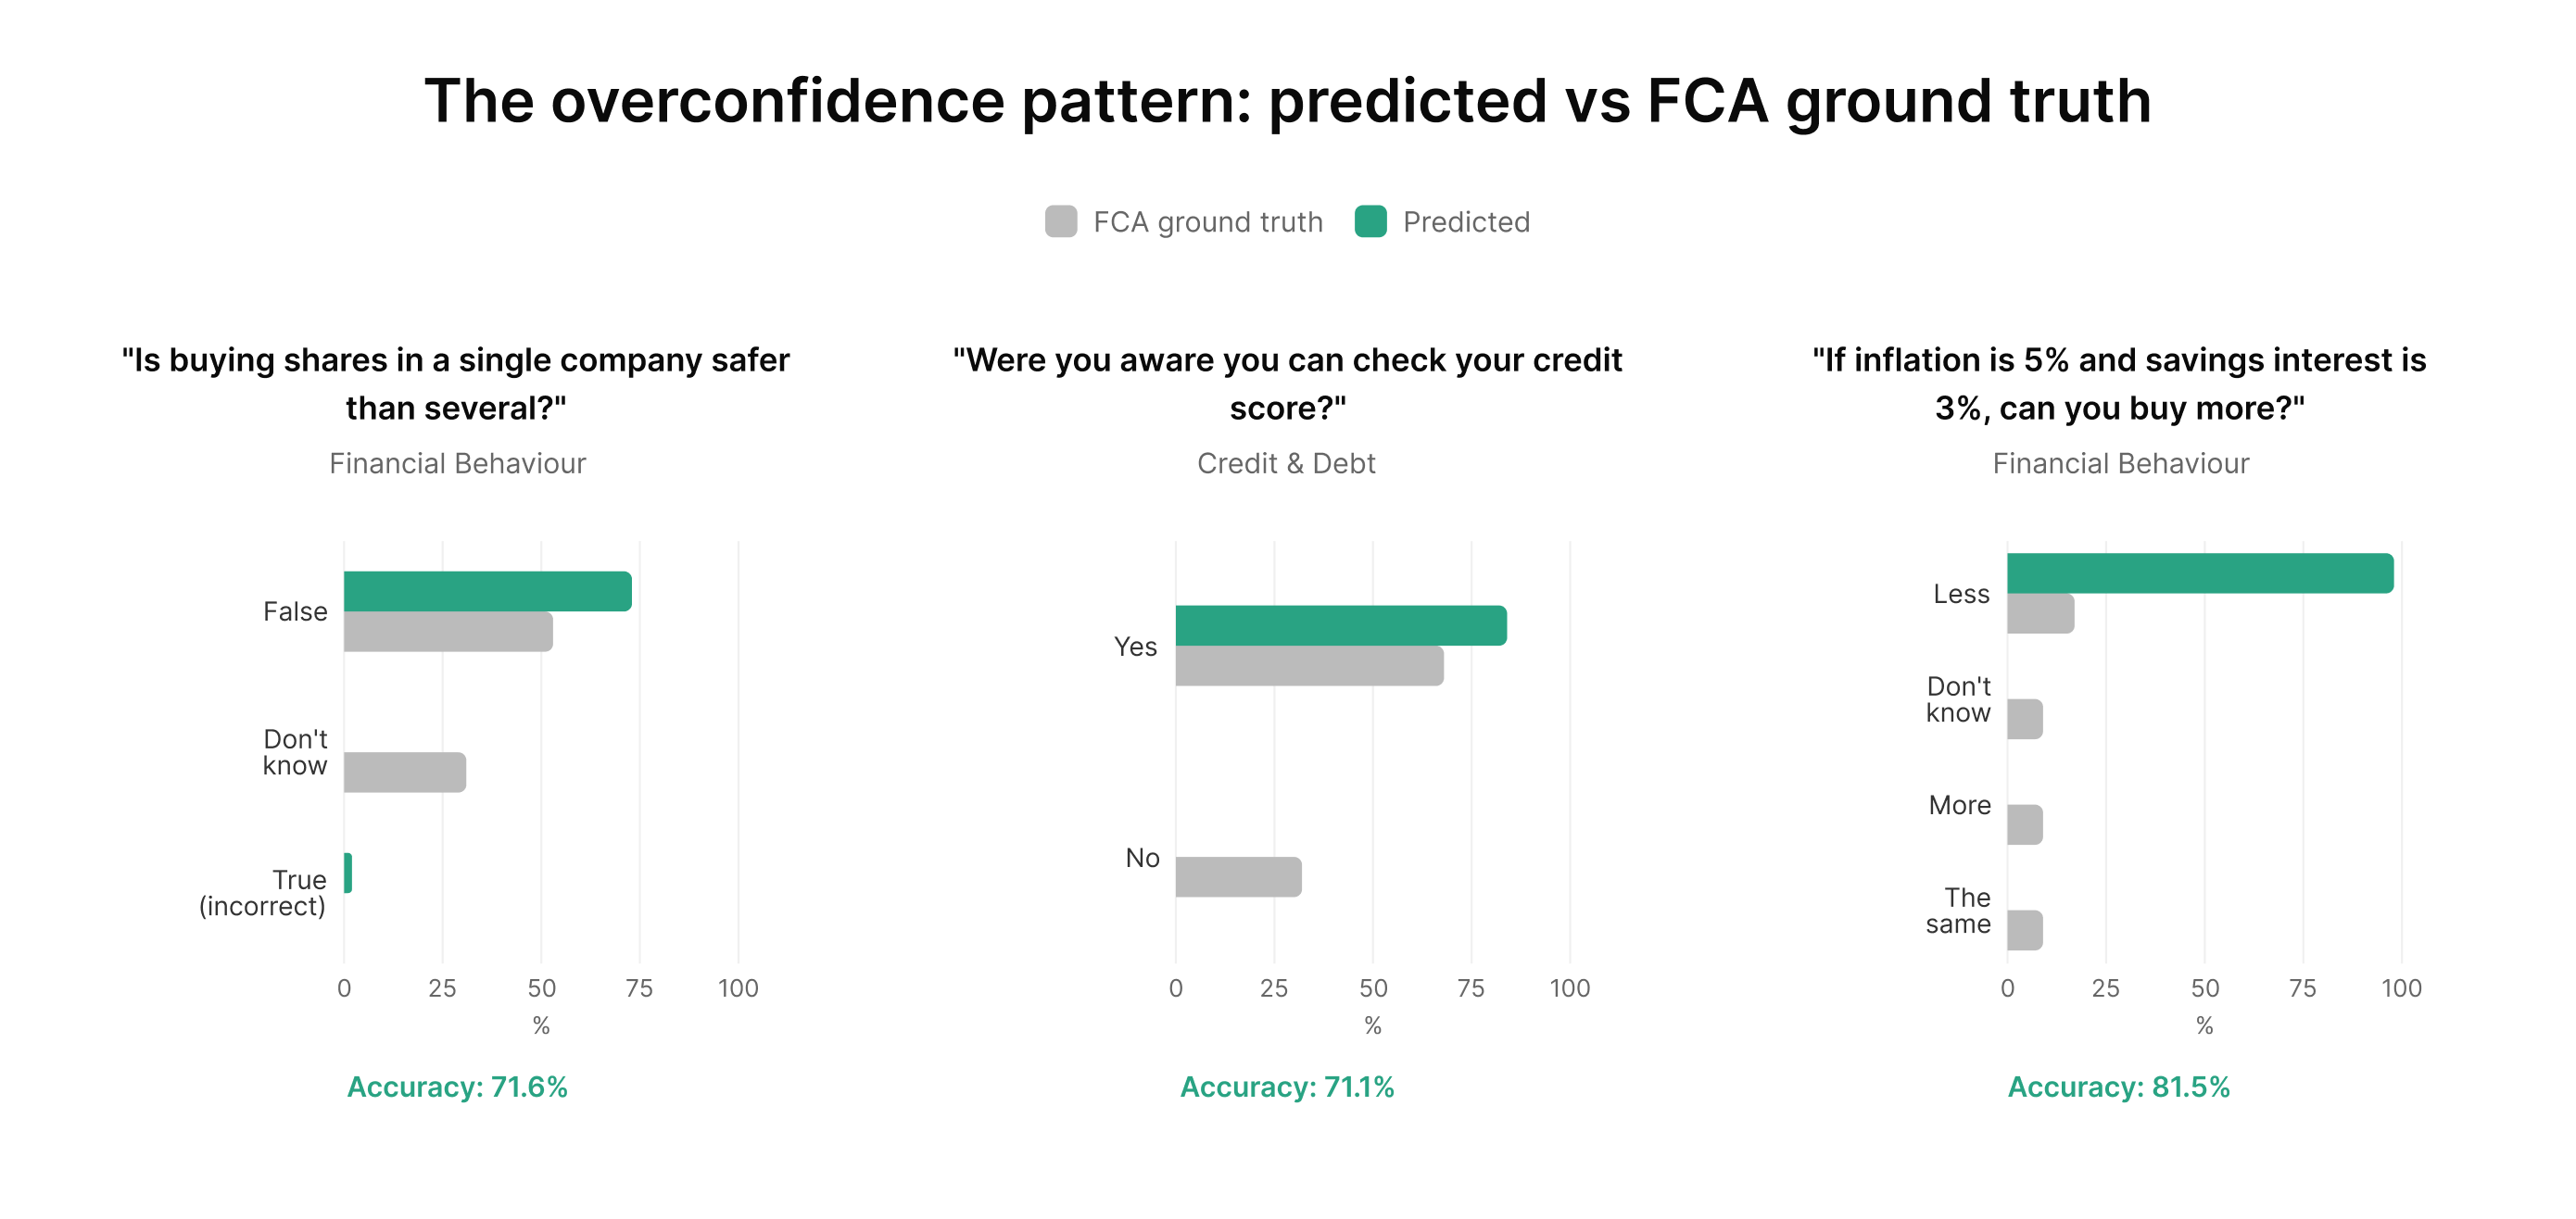
Then we asked a different question: "Is buying shares in a single company usually safer than buying shares in several different companies?" The correct answer is False: diversification is safer. The model predicted that 100% of respondents would get it right. In reality, only 57% said False. 39% said "Don't know." 4% said True. The model knew the right answer. It didn't account for the fact that many people don't.
Both of these are the same model, the same population, the same validation exercise. Understanding why it nails one and misses the other is the point of this post.
What we tested and why
Every product decision in consumer finance is a "what if" that usually goes unanswered. Semilattice simulates how the people that matter to you would respond, grounded in real survey data, and returns predictions in seconds. We believe this works. But we also believe that the only way to demonstrate it is to test against something external and rigorous, and to publish the results openly.
So we chose the hardest benchmark we could find. The FCA Financial Lives Survey 2024 is the UK regulator's own instrument: 19,000 respondents, nationally representative, covering attitudes, behaviours, product holdings, financial literacy, and demographics. We took 207 questions our model had never seen, got it to predict the response distributions, and compared those predictions to the FCA's results.
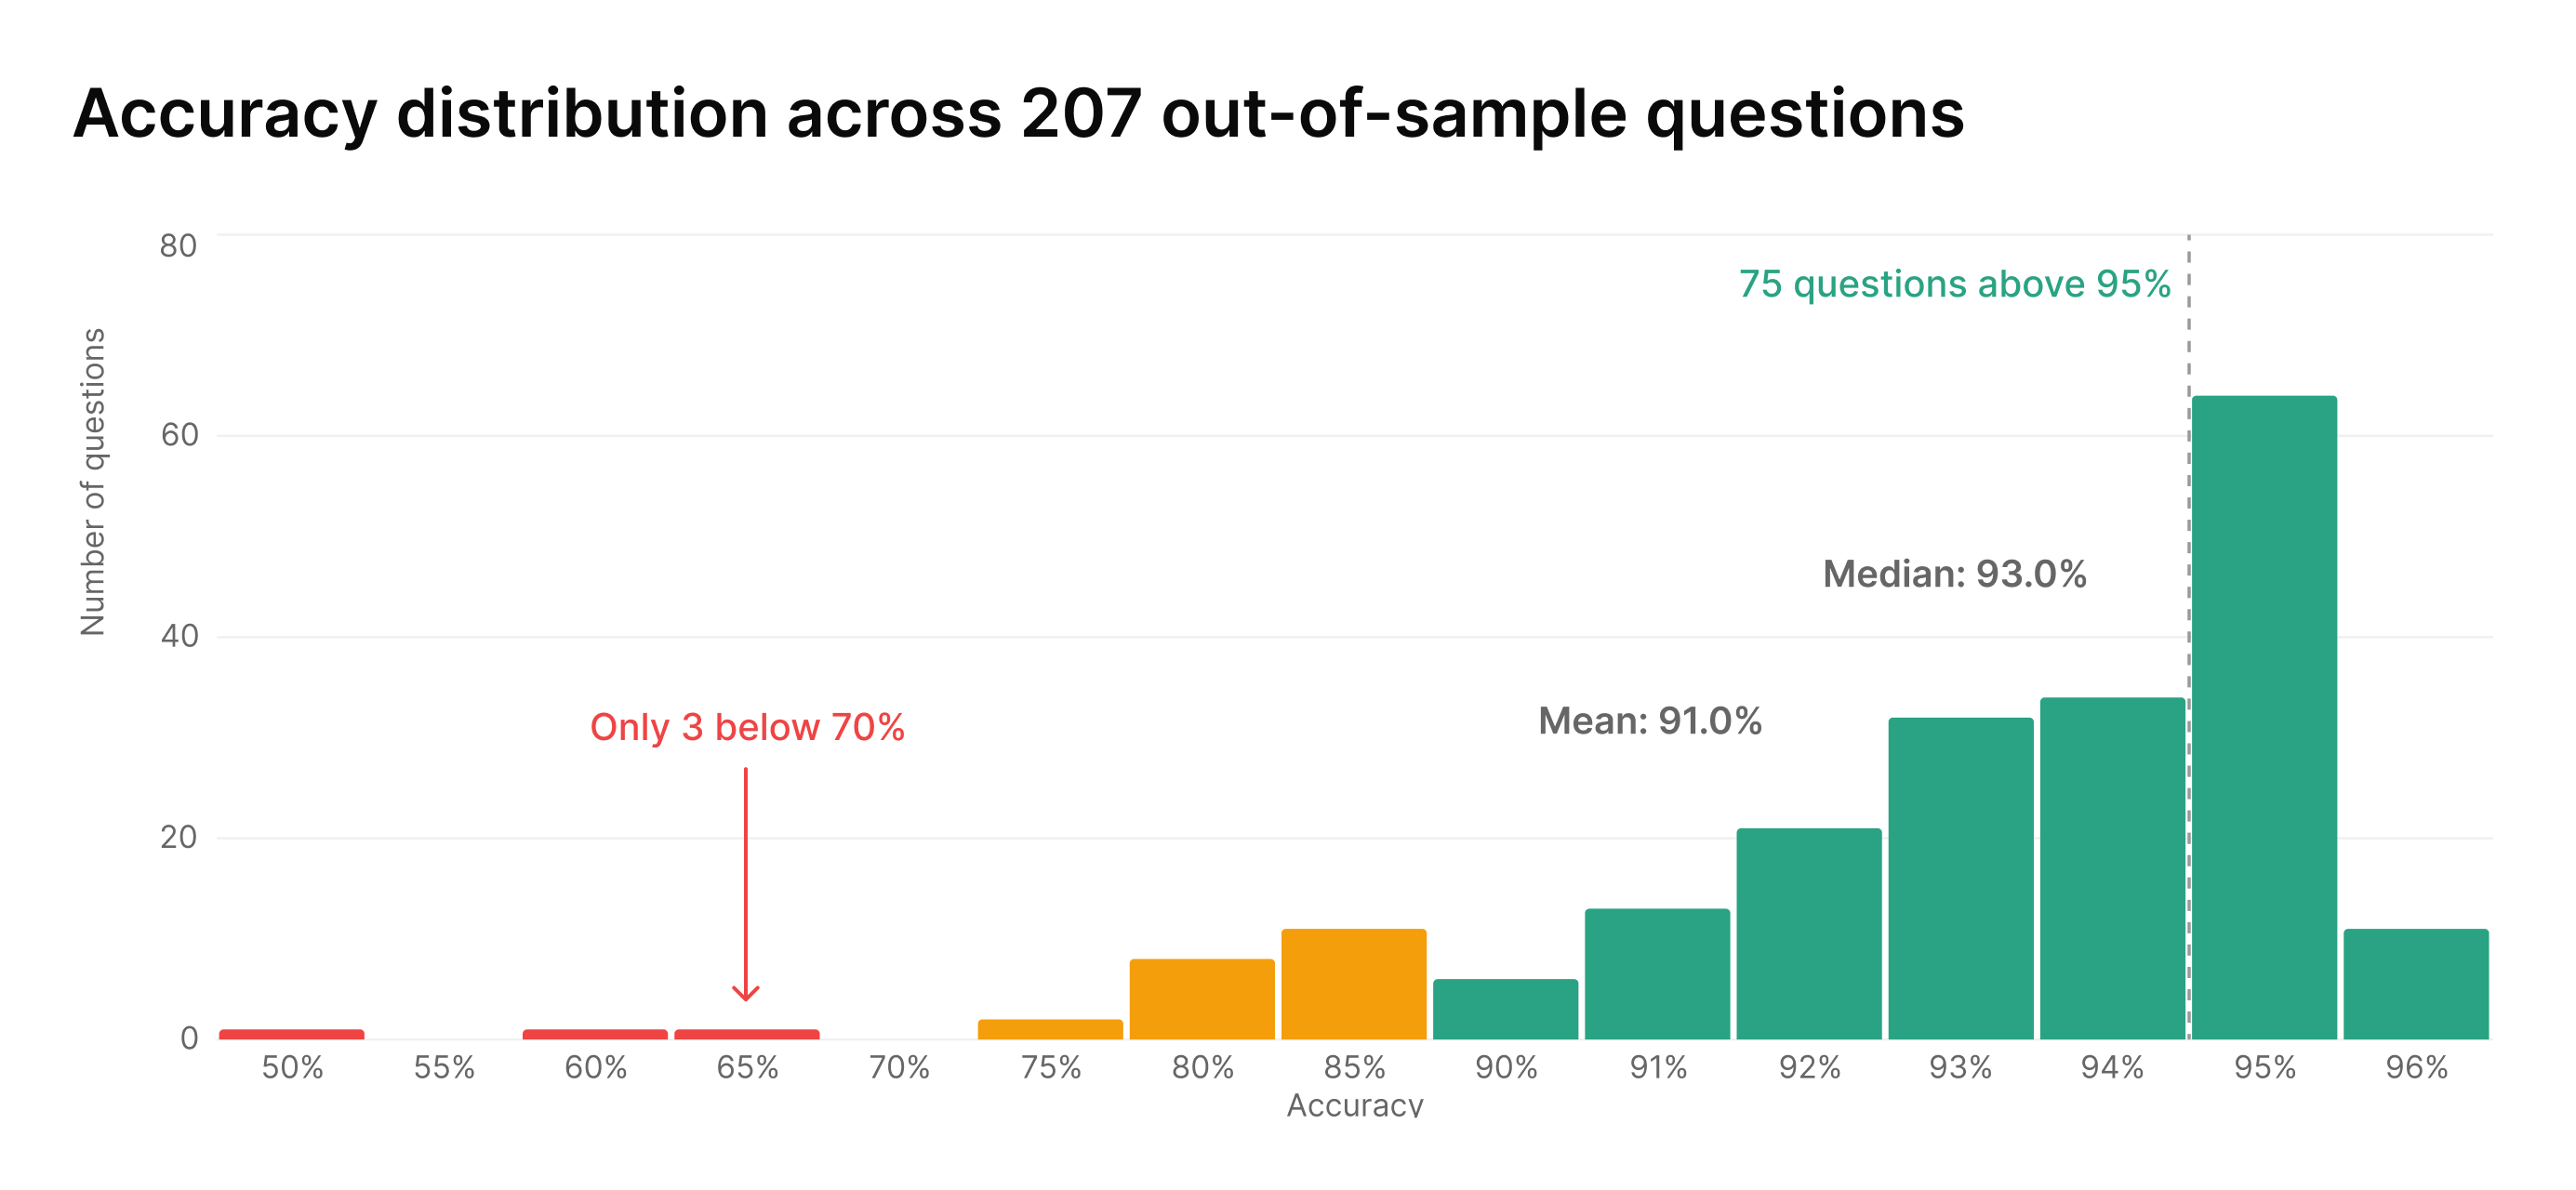
The average accuracy across all 207 questions was 91%. But the average is the least interesting part of the story.
The shape matters more than the number
If accuracy were evenly spread, you'd expect a gentle curve around 91%. That's not what the data shows. The distribution is dramatically skewed. 75 questions score above 95%. The median is 93%, not 91%. Only 3 questions out of 207 fall below 70%.
The mean is pulled down by a small tail of specific, identifiable questions where the model struggles. The broader picture: the model is very good at most things and notably weak on a few specific things. That distinction matters for how you use it. A model that's 93%+ on most questions, with a known set of harder cases, is a very different tool from one that's "91% accurate" across the board.
The pattern holds across question categories. Scale and agreement questions average 92.7%. Multiple choice: 94.3%. Attitudes and wellbeing: 90.4%. Credit and debt: 88.8%. Insurance and protection: 87.9%. Financial behaviour: 80.8%. Format predicts accuracy better than topic. Structured questions that naturally constrain the answer space are easier for the model to get right. That's a property of the measurement, not just the model.
What the model understands about populations
The model's strongest predictions share a common structure. They're questions where the answer follows from the kind of person you are: your demographics, your life stage, your financial situation, your attitudes. Things that are shaped by dozens of overlapping factors, all reinforcing each other.
Take language demographics. The FCA asked respondents to summarise their first language and ability to speak English. Five categories, from "English or Welsh is main language" down to "speak English not at all well." The model matched every option within a single percentage point. 91.3% predicted versus 92.1% actual on the dominant category. 0.9% versus 1.0% on the smallest. 99.6% accuracy.
Or take insurance understanding. "How well do you understand what your insurance product covers you for?" Five options from "Very well" to "Not at all well," plus "Don't know." The model matched the FCA within 3 percentage points on every option, including the tails. 98.7% accuracy on a subjective, product-specific question.
These aren't easy questions. An 11-point trust scale has 12 possible responses (including "Don't know"). Getting the distribution right across all 12 requires capturing not just which answer is most popular, but the full shape of how opinion is distributed. The model is doing something more than predicting the majority response. It's modelling the structure of how a population thinks.
The model is systematically overconfident
Now the other side. The most consistent pattern in the failures: the model is more certain than real people are.
65% of questions with a "Don't know" option see the model under-predicting it. The model pushes people toward definite answers. It knows the right answer to a financial literacy question and projects that knowledge onto the population. It predicts that 99.9% of people know they can check their credit report. In reality, 29% don't. It predicts that essentially everyone understands investment diversification. In reality, nearly four in ten say they don't know.
This pattern appears systematic rather than random, and that's important for how we think about improving the model. The model has learned what the likely answer is but hasn't fully learned that a substantial portion of real people don't know the likely answer. It tends to overpredict knowledge, engagement, and agency, modelling a more informed, more active consumer than the real population contains. Because the pattern is consistent and directional, it gives us a clear target for calibration improvements.
47% of questions show the model overpredicting the majority option. Same underlying dynamic: the model sharpens distributions, pushing probability mass toward the dominant answer and away from the tails. When the FCA asked whether people had complained about a credit product problem, the model predicted most had. In reality, nearly half didn't want to complain at all. The model assumes people act on their problems. Many people don't.
This is one of the most valuable things this analysis revealed. A model that fails randomly is hard to improve and hard to trust. A model that fails in a consistent, explainable direction is one you can understand, communicate about honestly, and improve in a principled way. We now know the bias has a specific character: overconfidence. That means we can measure it, track it across model versions, and build calibration corrections that address it directly.
The boundary between what populations know and what individuals did
There's a useful way to think about where the model works and where it doesn't. In survey methodology, some properties of a population are what you might call "thick." (The terminology is ours, but the idea is well-established.) A thick property is one that's overdetermined: shaped by many overlapping factors, all of which the model has access to. Attitudes toward money are thick. They follow from education, age, income, culture, personal temperament, all reinforcing each other. Any subset of those inputs gets you close. The model can triangulate.
Other properties are "thin." They depend on a single causal chain that doesn't generalise. Whether you've used Buy Now Pay Later in the last 12 months depends on whether you happened to encounter it at checkout, whether your financial situation was tight at a particular moment, whether the retailer offered it. These are downstream of demographics but not determined by them. BNPL usage is also temporally volatile. The FCA survey captures 2024 behaviour; adoption curves shift fast. The gap between our training data and the FCA's snapshot partly reflects a moving target, not just a modelling failure.
The model's accuracy boundary maps closely onto this thick/thin distinction. Attitudes, self-assessments, demographic patterns, and financial confidence: thick, and the model is typically 90%+ accurate. Specific product experiences, fast-moving adoption behaviours, and exposure-dependent knowledge: thin, and accuracy drops. The boundary is not about topic. Insurance attitudes (thick) and insurance auto-renewal behaviour (thin) live in the same domain but at different points on the gradient.
The further you move from "what kind of person are you" toward "what specific thing did you do on what specific day," the thinner it gets. A model that captures the thick structure of a population well and struggles with thin individual contingencies is not broken. It's correctly shaped. The lumpiness is proof of life.
What this means for your decisions
If you're using Semilattice to test attitudes, perceptions, financial confidence, or product sentiment: the model is strong. Treat the outputs as reliable signal. If you're using it to estimate precise adoption numbers for a fast-moving product behaviour: treat the outputs as directional, not exact.
Our Consumer Finance model is built for fintech product decisions. The underlying sample reflects that: younger, more digitally active, more employed than the UK average. That's by design. It means the model is strongest for the populations your product serves.
We're publishing these results because we believe transparency about what works and what doesn't is how trust gets built in this category. Not by claiming perfection. By showing the full picture and letting you decide what's useful.
We also built a feature for exactly this kind of validation. Test batches let you bring your own ground truth and find the accuracy boundary for your specific use case. The FCA validation is one benchmark. Yours might be different. The tool is there for you to find out.